Add Hosts to Zabbix
This guide covers how to register network devices and servers in your Zabbix monitoring system, including OpenWrt routers (Zabbix Agent), antennas (SNMP), and Linux servers (Zabbix Agent 2) with optional Docker monitoring.
This guide implements the concept introduced in Chapter 2 — Monitoring.
What You'll Learn
- How to add an OpenWrt router as a monitored host using Zabbix Agent
- How to configure the Zabbix agent on OpenWrt to accept server connections
- How to add an antenna or network device using SNMP
- How to install Zabbix Agent 2 on a Linux server (Debian/Proxmox or Ubuntu)
- How to optionally enable Docker container monitoring with Zabbix Agent 2
Prerequisites
- A running Zabbix server (7.0 LTS or later) accessible from your network. See Install Zabbix Server on Proxmox for deployment instructions.
- SSH access to the devices you want to monitor
- For OpenWrt devices: the
zabbix-agentdpackage available in the OpenWrt repository - For antennas: SNMP enabled on the device (most network equipment supports SNMPv2c by default)
- For Docker servers: a Debian/Ubuntu-based Linux server with Docker installed
Used Versions
| Software | Version |
|---|---|
| Zabbix Server | 7.4 |
| OpenWrt | 25.12.1 |
| Zabbix Agent 2 | 7.4 |
Got many devices? Skip to automatic discovery
If you need to add many hosts at once, Zabbix's built-in network discovery can scan your subnet and add devices automatically. See Step 6 — Discover hosts automatically before starting the manual steps below.
Step-by-Step Implementation
1. Create a host group for your devices
Before adding individual hosts, create a host group to organize them.
- Log in to the Zabbix web interface.
- Navigate to Data collection → Host groups.
- Click Create host group.
- Enter a name (e.g.,
Routers,Antennas, orServers). - Click Add.
Why host groups?
Host groups let you organize monitored devices by type, location, or role. You can later assign permissions, filter dashboards, and scope alert rules by group. Create separate groups for routers, antennas, and servers.
2. Add an OpenWrt router (Zabbix Agent)
2a. Install and configure the agent on the router
- SSH into your OpenWrt router.
-
Install the Zabbix agent package:
-
Edit the agent configuration to allow your Zabbix server to connect:
Replace with your Zabbix server IP
You must replace
192.168.1.1with the actual IP address of your Zabbix server.Allowing a subnet instead of a single IP
The
Server=parameter also accepts CIDR notation. If your Zabbix server might move between addresses on the same subnet, you can useServer=192.168.1.0/24to allow any host on that subnet to query the agent. For most deployments, specifying the exact Zabbix server IP (e.g.,192.168.1.1) is more secure. -
Restart the agent to apply the changes:
2b. Register the router in the Zabbix web interface
- In the Zabbix web interface, navigate to Data collection → Hosts.
-
Click Create host (top-right corner).
Already discovered?
If you used the automatic discovery method (Step 6), the host may already exist. In that case, click on it to edit and continue with the next sub-steps.
-
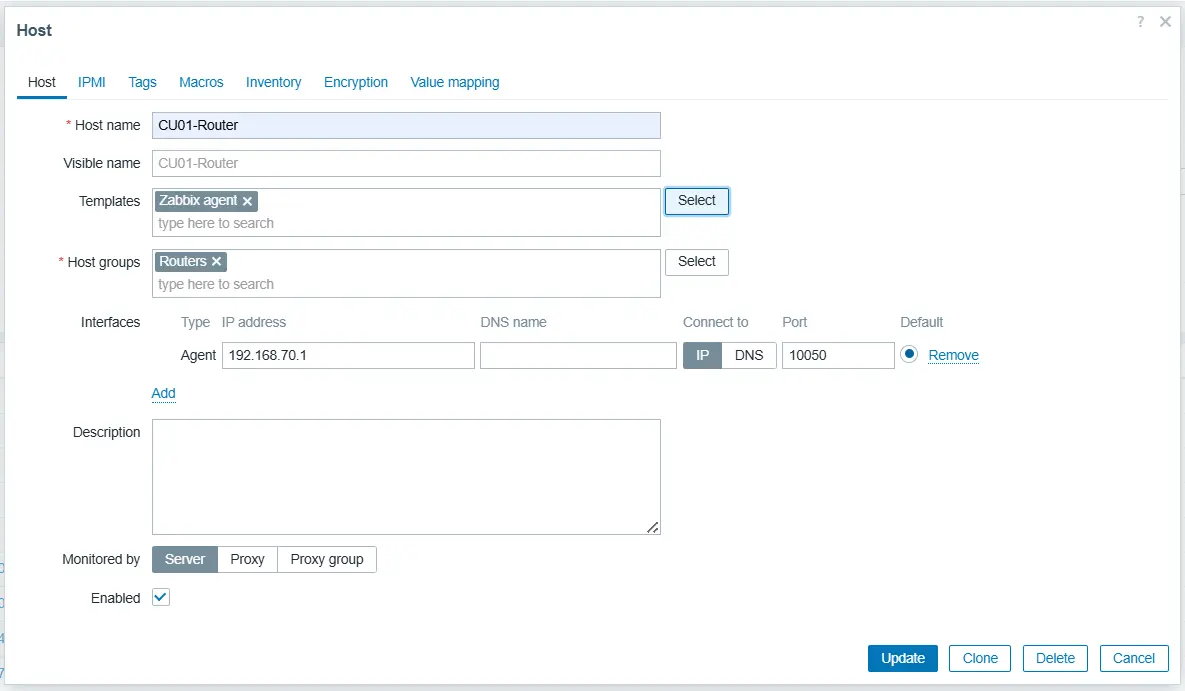
Fill in the host configuration:
- Host name: a descriptive name (e.g.,
router-library) - Host groups: select the group you created (e.g.,
Routers) - Interfaces: click Add and select Agent
- IP address: the router's IP (e.g.,
192.168.10.2) - Port:
10050(default)
- IP address: the router's IP (e.g.,
- Host name: a descriptive name (e.g.,
- Go to the Templates tab, click Select, and link the Linux by Zabbix agent template.
- Click Add to save the host.
Verify the connection
After adding the host, wait a few minutes and check the Availability column on the Data collection → Hosts page. A green ZBX icon means the Zabbix server can reach the agent. A red icon indicates a connectivity or configuration problem.
3. Add an antenna or network device (SNMP)
Most wireless antennas and managed switches support SNMP for monitoring. The process is similar to adding an agent-based host, but you select the SNMP interface instead.
- In the Zabbix web interface, navigate to Data collection → Hosts.
- Click Create host.
- Fill in the host configuration:
- Host name: a descriptive name (e.g.,
antenna-rooftop-north) - Host groups: select or create a group (e.g.,
Antennas) - Interfaces: click Add and select SNMP
- IP address: the device's IP address
- Port:
161(default SNMP port) - SNMP version: select the version your device supports (typically
SNMPv2) - SNMP community: enter the community string (default is usually
public)
- Host name: a descriptive name (e.g.,
- Go to the Templates tab and link the appropriate template for your device (e.g.,
ICMP Ping, or a vendor-specific SNMP template). - Click Add to save the host.
Finding the right SNMP template
Zabbix ships with many built-in SNMP templates for common vendors (Ubiquiti, MikroTik, Cisco, etc.). Browse Data collection → Templates and search for your device brand. If no specific template exists, the generic Network Generic Device by SNMP template covers basic metrics like uptime, interface traffic, and ICMP availability.
SNMP community string security
The default public community string provides read-only access, which is sufficient for monitoring. If your device uses a custom community string, enter it here. Avoid using private as a community string in production, as it typically grants write access.
4. Add a Linux server (Zabbix Agent 2)
Zabbix Agent 2 is a modern monitoring agent that supports extended plugins (including Docker). This step covers installing it on any Debian-based Linux server.
4a. Install Zabbix Agent 2 on the server
- SSH into your Linux server.
-
Download and install the Zabbix repository package for Debian 12 (Bookworm), which also applies to Proxmox VE:
-
Install Zabbix Agent 2:
Why no plugin wildcard?
Earlier versions of this guide used
zabbix-agent2-plugin-*to install all available plugins. That wildcard pulls in hardware-specific plugins such aszabbix-agent2-plugin-nvidia, which causes the agent to fail on machines without an NVIDIA GPU. The Docker monitoring plugin is built into Zabbix Agent 2 itself and does not require a separate package, so the wildcard is not needed for any use case in this guide.Expected startup error during install
When installing, dpkg tries to start the service immediately. This will fail because the configuration has not been set yet. This is expected — proceed to the next steps to configure the agent, then start it manually.
-
Edit the agent configuration file:
-
Set the following parameters (replace with your actual values):
-
Start and enable the agent:
4b. Register the server in the Zabbix web interface
- In the Zabbix web interface, navigate to Data collection → Hosts.
- Click Create host.
- Fill in the host configuration:
- Host name: must match the
Hostnameset inzabbix_agent2.conf(e.g.,server-01) - Host groups: select or create a group (e.g.,
Servers) - Interfaces: click Add and select Agent
- IP address: the server's IP (e.g.,
192.168.10.4) - Port:
10050
- IP address: the server's IP (e.g.,
- Host name: must match the
- Go to the Templates tab and link the
Linux by Zabbix agent activetemplate. - Click Add to save the host.
Verify the connection
After adding the host, wait a few minutes and check the Availability column on the Data collection → Hosts page. A green ZBX icon means the Zabbix server can reach the agent.
5. (Optional) Enable Docker monitoring
If your Linux server runs Docker, you can extend the Zabbix Agent 2 installation from Step 4 to monitor containers. Zabbix Agent 2 includes a built-in Docker plugin that the classic zabbix-agentd does not support.
5a. Grant Docker access to the Zabbix user
-
Add the
zabbixuser to thedockergroup so the agent can query Docker: -
Restart Zabbix Agent 2 for the group change to take effect:
-
Verify that the agent can read Docker data. Install
zabbix-getif not already available: -
Test the Docker integration from the Zabbix server (or any machine with
zabbix-get):A successful response returns JSON with Docker engine information.
Check the logs if it fails
If zabbix_get returns an error, check the agent log for details:
Common issues include the zabbix user not being in the docker group, or the Docker socket permissions being too restrictive.
5b. Link the Docker template in the Zabbix web interface
- In the Zabbix web interface, navigate to Data collection → Hosts.
- Click on the host you registered in Step 4b.
- Go to the Templates tab and click Select.
- Search for and link the
Docker by Zabbix agent 2template. - Click Update to save.
Verify Docker monitoring
After a few minutes, navigate to Monitoring → Hosts, click on your Docker server, and check the Latest data tab. You should see items like docker.containers.running, docker.images, and individual container metrics.
6. (Optional) Discover hosts automatically
Instead of creating every host manually, you can let Zabbix scan your network and add discovered devices on its own. This is useful when you have many hosts and want a quick initial inventory.
6a. Enable the built-in discovery rule
- In the Zabbix web interface, navigate to Data collection → Discovery.
-
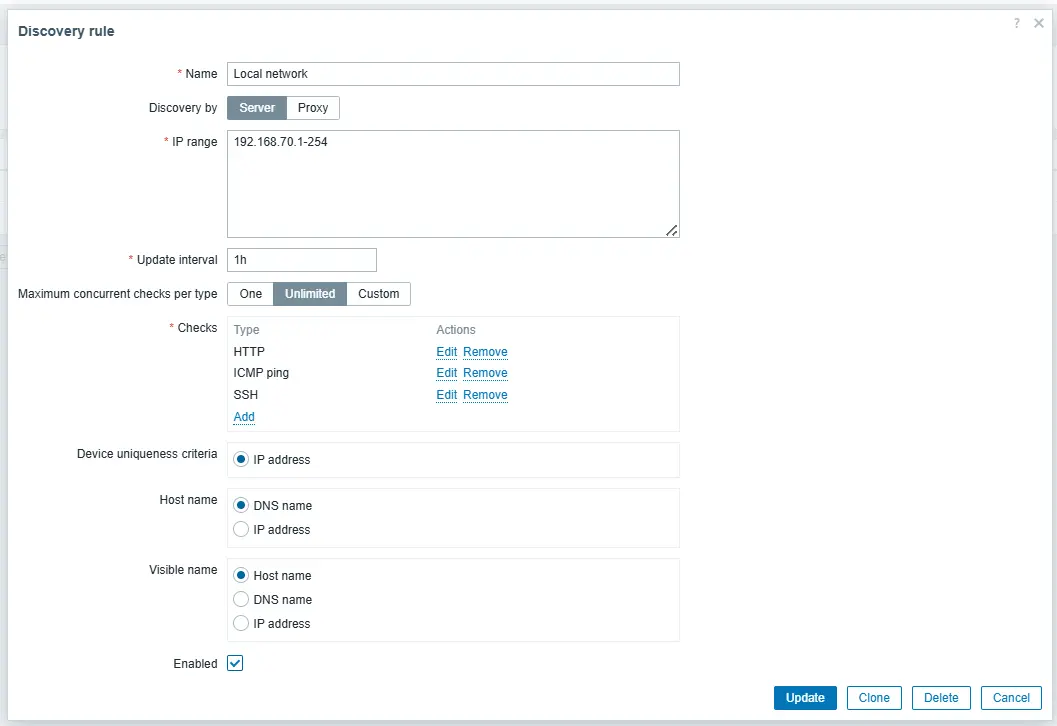
You will see a pre-configured rule called Local network. Click on it to edit.
Default scan range
The default rule is pre-configured to scan the subnet your Zabbix server belongs to. Adjust the IP range field if your network layout differs.
-
Scroll down to the Checks section. By default it only checks for the Zabbix agent on port 10050. Since you may not have agents installed on every device yet, remove that check and add more generic ones:
- ICMP ping
- HTTP (port 80)
- SSH (port 22)
-
Set the Update interval to a value appropriate for your network (e.g.,
5mfor initial scanning, increase it later). - Tick the Enabled checkbox at the bottom of the form.
- Click Update to save.
6b. Create a discovery action
A discovery rule alone only scans — you need an action to tell Zabbix what to do with the results.
- Navigate to Alerts → Actions → Discovery actions.
- Click Create action.
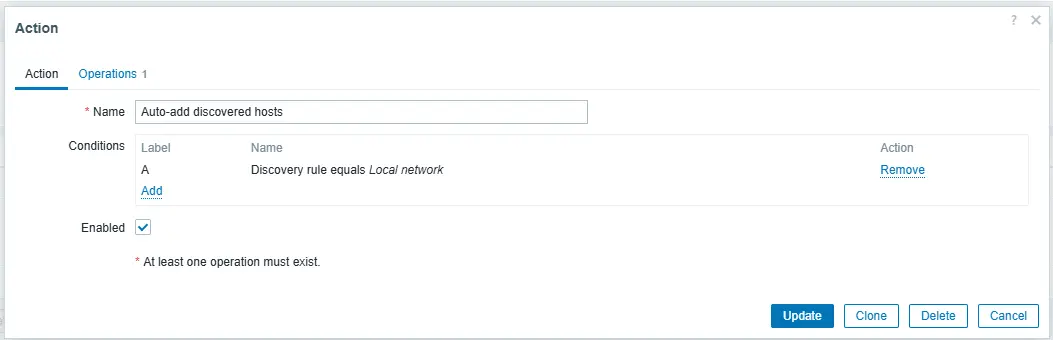
- On the Action tab, give it a name (e.g.,
Auto-add discovered hosts). -
Under Conditions, click Add:
- Set the condition type to Discovery rule.
- Click Select and choose the Local network rule you just enabled.
-
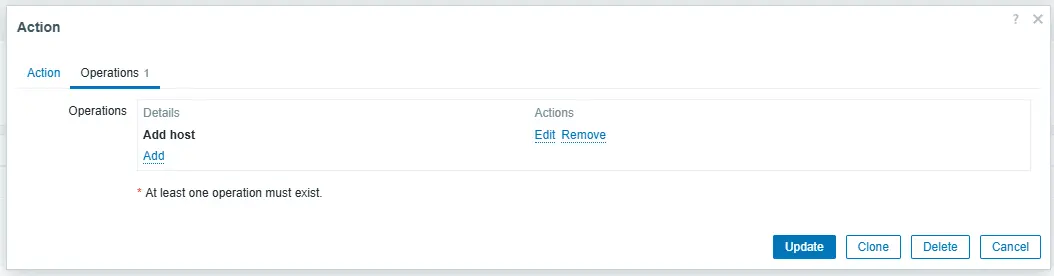
Switch to the Operations tab and click Add.
-
Select Add host as the operation type.
-
Click Add to save the action.
Additional operations
Besides Add host, you can also configure operations to add the host to a specific group, link a template, or send a notification. These are useful once you have a more established monitoring setup.
6c. Verify discovered hosts
- Navigate to Monitoring → Discovery.
-
Wait several minutes for the scan to complete. If no results appear after a few minutes, restart the Zabbix server:
-
After the scan runs, you should see a list of discovered IP addresses along with which checks succeeded (ping, HTTP, SSH).
Discovery can take time
Depending on the size of your subnet and the configured interval, the initial scan may take several minutes. Hosts appear gradually as they are discovered.
Next steps after discovery
Automatically discovered hosts will not have templates assigned unless you configure that in the action's operations. After the initial discovery, review the host list under Data collection → Hosts and manually assign the appropriate templates (Zabbix Agent, SNMP, etc.) to each device as described in the steps above.
References
- YouTube: "Add Zabbix - Monitoring and Alerting with @AwesomeOpenSource" — https://www.youtube.com/watch?v=DFdDEf5iib4&t=67s
- Zabbix 7.0 Documentation — Configuring a host — https://www.zabbix.com/documentation/7.4/en/manual/config/hosts/host
- Zabbix 7.0 Documentation — SNMP agent monitoring — https://www.zabbix.com/documentation/7.4/en/manual/config/items/itemtypes/snmp
- Zabbix 7.0 Documentation — Docker plugin (Agent 2) — https://www.zabbix.com/documentation/7.4/en/manual/appendix/config/zabbix_agent2_plugins/d_plugin
- Zabbix Agent configuration parameters — https://www.zabbix.com/documentation/7.4/en/manual/appendix/config/zabbix_agentd
- Zabbix 7.0 Documentation — Network discovery — https://www.zabbix.com/documentation/7.4/en/manual/discovery/network_discovery
Revision History
| Date | Version | Changes | Author | Contributors |
|---|---|---|---|---|
| 2026-04-01 | 1.0 | Initial guide creation | Jaime Motjé | Sergio Giménez, Joan Torres |